usage:
This article is part 1 in a series of 3 articles regarding 18 Linux system monitoring tools you should know.
In these articles we’re going to cover some built-in system monitoring tools as well as some open source add-on tools which will make your life easier when troubleshooting issues in your server.
In this specific article we’ll discuss Memory and Process monitoring.
usage:
You can find the other articles here:
18 Linux System Monitoring Tools – part 2 – System
18 Linux System Monitoring Tools – part 3 – Networking
Most Linux distributions are equipped with many monitoring tools.
These monitoring tools provide metrics which can be used to get information about system activities, such as Disk (storage) usage, CPU and memory, or Network bottlenecks.
You can use the monitoring tools to find the possible causes of a performance issue.
The commands discussed in this article are some of the most basic monitoring commands when it comes to
system analysis and debugging server issues such as:
- Finding out bottlenecks.
- Disk (storage) bottlenecks.
- CPU and memory bottlenecks.
- Network bottlenecks.
usage:
The commands we’re going to cover in this article are:
top
vmstat
ps
free
mpstat
pmap
Table of Contents
#1 : Top – Processes monitoring, Load, Uptime
The command is:
# top
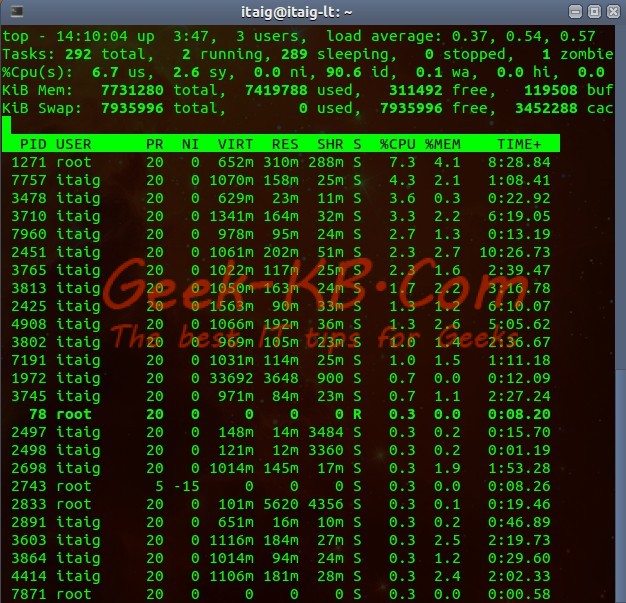
Basic process monitoring can be done with top. it provides a dynamic real-time view of a running system, for example; actual process activity.
usage:
By default, it displays the most CPU-intensive tasks running on the server and updates the list every 5 seconds.
Example:
Commonly Used Hot Keys:

Hot Key                       Usage

t            Displays summary information off and on.

m            Displays memory information off and on.

A            Sorts the display by top consumers of various system resources.
             Useful for quick identification of performance-hungry tasks on the system.

f            Enters an interactive configuration screen for top. Helpful for setting up top for a specific task.

o            Enables you to interactively select the ordering within top.

r            Issues renice command.

k            Issues kill command.

z            Turns on or off color/mono.
I have written an article about a nice tool which replaces Top and gives you more sorting options and displays the metric in a nicer method,
that will help you with process monitoring.
feel free to check it: Tip: Changing Linux top tool to htop.
#2 : vmstat – System activity, hardware and system information
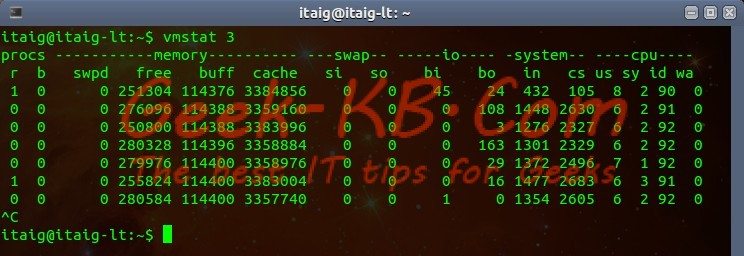
The command vmstat reports information about processes, memory, paging, block IO, traps and CPU activity.
# vmstat 3
Example:
usage:
Display Memory Utilization Slabinfo
# vmstat -m
Get Information About Active / Inactive Memory Pages
# vmstat -a
#3 : ps – Basic process monitoring: Displays the Processes
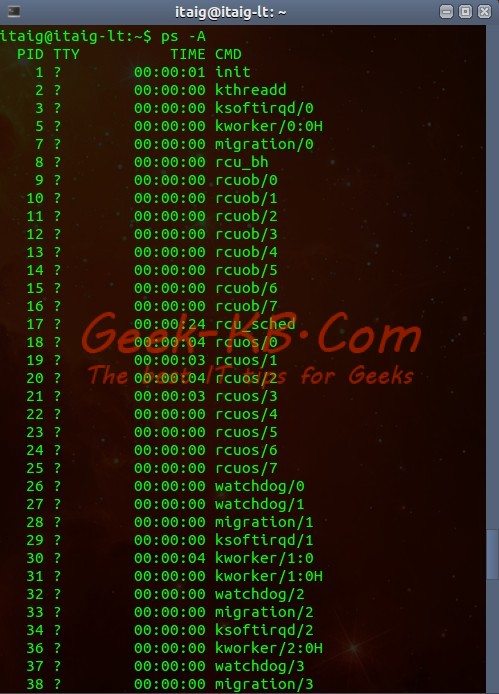
ps command will reports a snapshot of the current running processes. To select all processes, use the -A or -e options:
The command is:
# ps -A
Example:
usage:
ps is just like top but provides more information.
Show long format output
# ps -Al
To turn on extra full mode (it will show command line arguments passed to process):
# ps -AlF
To see threads (LWP and NLWP)
# ps -AlFH
To see threads after processes:
# ps -AlLm
Print all processes on the server
# ps ax

# ps aux
Print a process tree
# ps -ejH

# ps axjf

# pstree
Print security information
# ps -eo euser,ruser,suser,fuser,f,comm,label
# ps axZ
# ps -eM
See every process running as user itaig
# ps -U itaig -u itaig u
Set output in a user-defined format
# ps -eo pid,tid,class,rtprio,ni,pri,psr,pcpu,stat,wchan:14,comm
# ps axo stat,euid,ruid,tty,tpgid,sess,pgrp,ppid,pid,pcpu,comm
# ps -eopid,tt,user,fname,tmout,f,wchan
Display only the process IDs of Lighttpd
# ps -C lighttpd -o pid=
Or
# pgrep lighttpd
Display the name of pid
# ps -p 3478 -o comm=
Find out the top 10 memory consuming processes
# ps -auxf | sort -nr -k 4 |head -10
#4 : free – Memory Usage monitoring
The command free displays the total amount of free and used physical and swap memory in the system, as well as the buffers used by the kernel.
# free
Example:
usage:
#5 : mpstat – Multiprocessor Usage
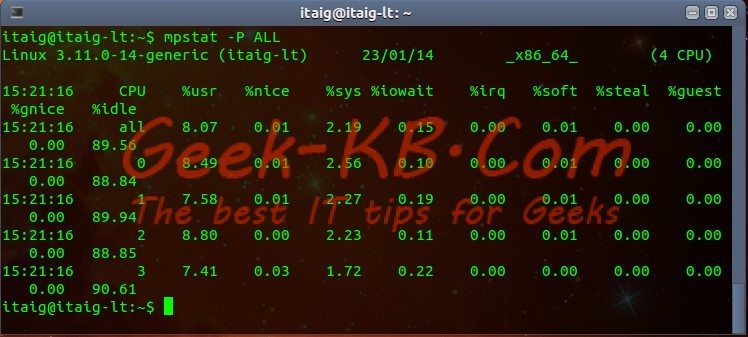
The mpstat command displays activities for each available processor, processor 0 being the first one.
mpstat -P ALL to display average CPU utilization per processor:
# mpstat -P ALL
Example:
#6 : pmap – Process Memory Usage
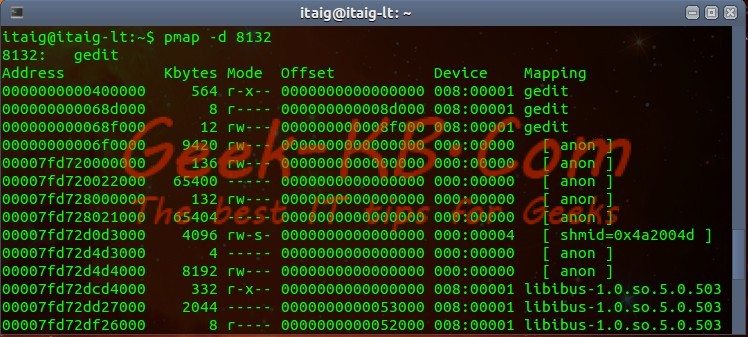
The command pmap reports memory map of a process. Use this command to find out causes of memory bottlenecks.
# pmap -d PID
To display process memory information for pid # 8132, enter:
# pmap -d 8132
Example:
usage:
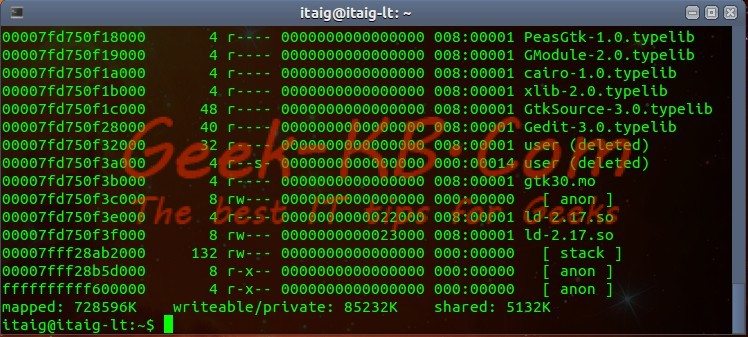
The last line is very important:
- mapped: 728596K – Total amount of memory mapped to files
- writeable/private: 85232L – The amount of private address space
- shared: 5132K – The amount of address space this process is sharing with others.
Please continue reading part 2 and 3 regarding system monitoring tools which will help you troubleshoot issues regarding your System and Networking.
Feel free to leave comments or ask questions.



No Comments Yet